You're probably looking at a pricing review, a launch brief, or a leadership request that needs a competitive analysis sample you can reuse. The problem is that many templates collect facts without showing which evidence is strong enough to drive a decision. That leaves product marketing, CI, and GTM teams with noisy notes, weak confidence, and no clear path from public competitor change to a defensible action.
A better sample does three things at once. It captures what changed, keeps the evidence chain inspectable, and shows what to review next. That matters in the UK especially, because the business environment is large and active, with 5.7 million private sector businesses at the start of 2025, up 3.5% from 2024 and up 1.2 million from 2010 according to the Department for Business and Trade business population estimates. In a market that moves that much, static worksheets age fast.
The strongest samples also fit how the UK competition environment is judged. The CMA uses multiple competition indicators, not one, because cost markups, static concentration, and business dynamism can move differently across industries State of UK Competition Report 2024. That logic carries straight into competitive analysis. One homepage tweak or one price change rarely proves strategy on its own.
Table of Contents
- 1. Competitive Positioning Matrix
- 2. Pricing and Packaging Audit
- 3. Product Feature and Roadmap Comparison
- 4. Go-to-Market and Campaign Activity Tracker
- 5. Talent and Organisational Signals Report
- 6. Messaging and Narrative Evolution Timeline
- 7. Partnership, Integration, and Ecosystem Activity Report
- 8. Investor Materials and Strategic Disclosure Analysis
- 8-Point Competitive Analysis Matrix
- Next Steps for CI Excellence
1. Competitive Positioning Matrix
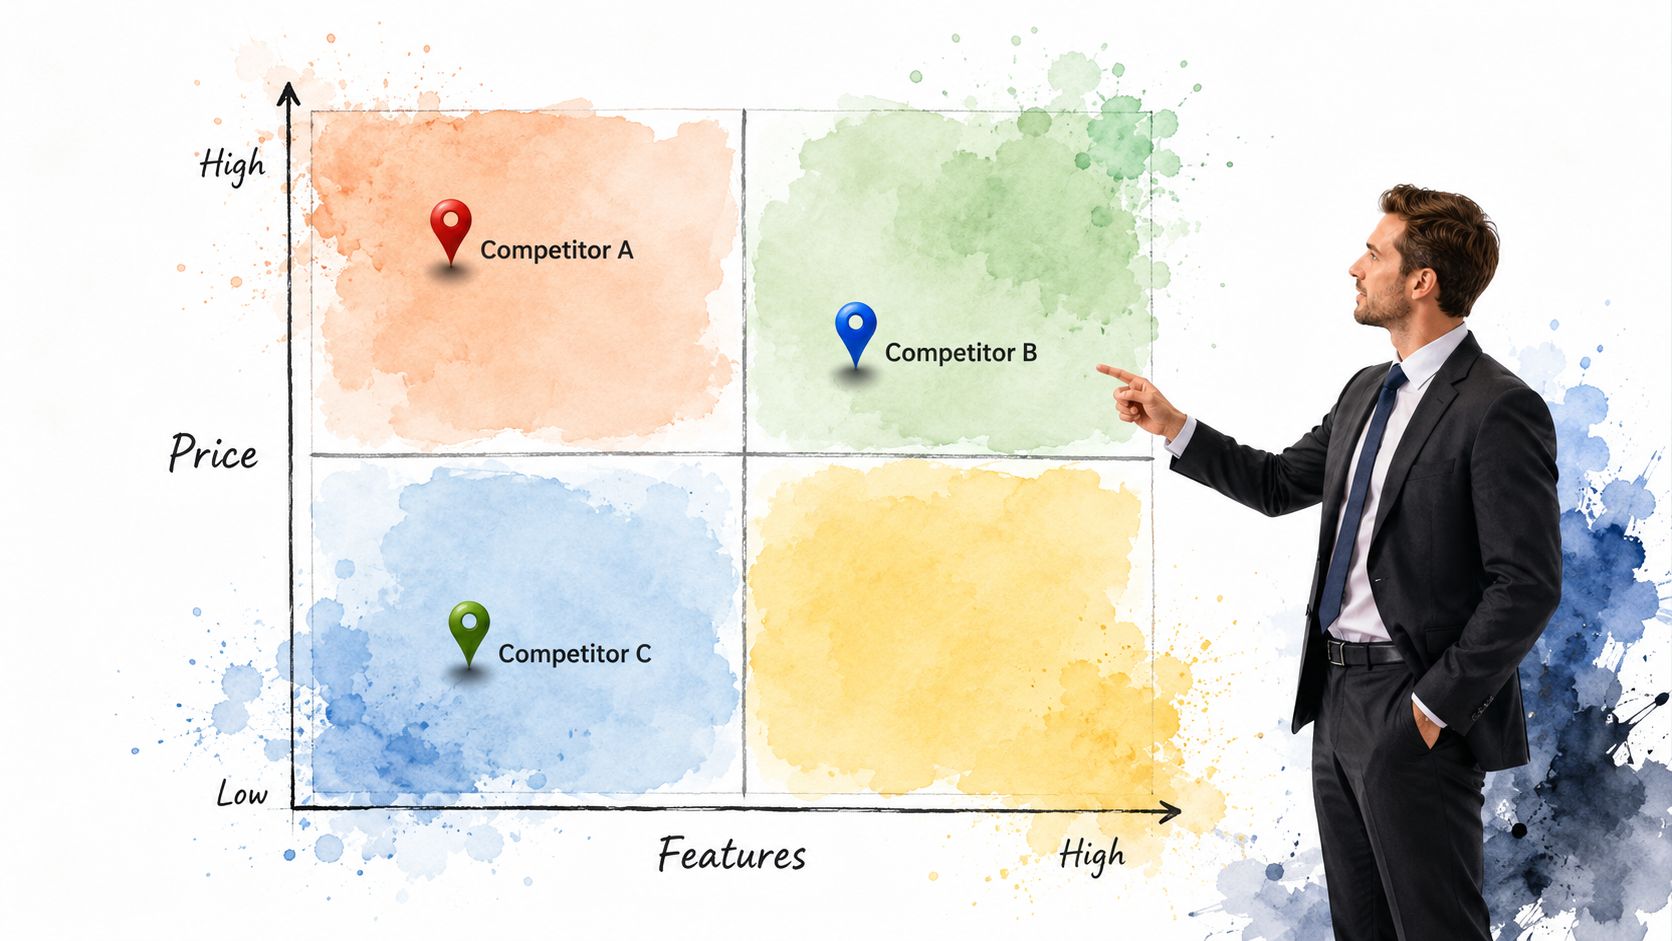
A positioning matrix works best when the cells are tied to public claims, not internal opinions. A B2B analytics team might map rivals by buyer persona, pricing posture, and problem framing, then notice one competitor moving from engineer-first language to business-user-accessible positioning. That is a useful signal because the matrix captures the narrative shift in one place, while the timestamps show whether the change is isolated or part of a broader repositioning effort.
What to record in the grid
Use rows for competitors and columns for the dimensions that matter in your category. The most useful columns are usually price band, feature depth, target buyer, and segment focus. Then attach source URLs and capture dates to each claim so the matrix remains auditable.
Practical rule: if a rival's messaging changes but the grid doesn't include a timestamp, you've recorded a snapshot, not intelligence.
The value is in comparison over time. A fintech compliance team, for example, could see three rivals claiming AI-powered risk detection in a short window and treat that as a convergence pattern rather than a series of random copy updates. The matrix helps sales and product teams review whether the category is drifting toward a shared narrative or whether one rival is opening a distinct lane.
Anchor the matrix to your own messaging as well. If your story is converging with competitors by accident, the grid will show it. If you've missed a gap in the market, the same grid will show that too. Metrivant's competitive assessment framework aligns with that logic because it treats public movement as evidence first and interpretation second.
2. Pricing and Packaging Audit
Pricing pages look simple until you compare them across rivals with different billing models. A pricing and packaging audit should capture the monthly and annual options, the value metric, the add-ons, and any feature shifts between tiers. That gives pricing, enablement, and leadership teams a shared view of how competitors are framing value, not just how much they charge.
Why the baseline matters
A single screenshot is easy to misread. A baseline series lets you spot when a rival removes a mid-tier, shifts a feature upward, or changes the prominence of a plan. That distinction matters because a change in packaging often says more about strategy than the headline price does.
A security vendor, for instance, may notice a competitor consolidating from three tiers to two. That could indicate margin simplification, a segment change, or a push to narrow the selling motion. The evidence does not prove which one, but it does justify closer review. Metrivant's competitor price monitoring is relevant here because the workflow starts with capture and comparison, then moves to confidence-gated interpretation.
Pricing evidence should always trigger a packaging question. If a feature moves up a tier, ask whether the market now expects that feature as standard, or whether the competitor is protecting margin.
A useful audit sample also supports sales immediately. Reps can use it to answer questions like what a rival charges for a specific capability, whether a feature is bundled or metered, and how the competitor frames value on the page. That's especially useful when the pricing page itself is the best public proof you have. The available evidence doesn't establish the rival's discounting posture in live deals, but it does show the public price architecture buyers are likely to see first.
3. Product Feature and Roadmap Comparison
Feature comparisons are most useful when they separate announced, shipped, and implied movement. A competitor can talk about a feature in a release post, show it in a product page, or hint at it through hiring. Those are different evidence levels, and a strong sample keeps them distinct.
An analytics platform might notice all three primary competitors add predictive anomaly detection within a short window. That doesn't prove any one of them has a durable advantage. It does suggest the market expectation is shifting, and your roadmap discussion should reflect that.
How to keep the comparison defensible
Start with product pages, changelogs, and release notes. Then add hiring signals where they are clearly linked to a product area. If a compliance vendor sees a rival hiring engineers for an API ecosystem right after launching integrations, that combination is a stronger signal than either item alone. The evidence suggests a platform strategy shift, but further confirmation is needed before any firm conclusion.
Use short bullets in the template so the team can scan fast.
- Feature status: Mark whether the capability is announced, visible in product, or only hinted at through related signals.
- Comparable scope: Note whether the feature is core, add-on, or tier-specific.
- Commitment strength: Record whether evidence appears in one source or across several public sources.
- Operator action: Decide whether product, enablement, or sales needs a response.
Metrivant's example competitor analysis fits this workflow because it links public change to a structured review path rather than treating every page update as meaningful by default. That discipline matters if you are deciding whether to fast-follow, differentiate, or hold position.
4. Go-to-Market and Campaign Activity Tracker
Campaign tracking is where many teams first notice a rival changing its market posture. The homepage shifts, the email themes change, and a few weeks later the sales team starts hearing the same message from prospects. A good sample records those public moves together so you can see whether the campaign is isolated or integrated.
A useful example comes from enterprise software teams watching rivals move toward mid-market SMB messaging across LinkedIn and search. The observation is simple. The interpretation is stronger. If the message appears across multiple channels, the competitor may be shifting away from enterprise-led positioning and into a broader acquisition play.
What the tracker should show
Capture the channel, the message theme, the timing, and the public asset. That includes homepage swaps, campaign landing pages, event sponsorships, press releases, and email sequences. The question isn't just what they said. It's whether they repeated it in enough places to make it a real campaign.
Metrivant's competitor launch detection is a relevant model because it helps capture public movement before it becomes common knowledge inside the market. In practice, that means the tracker should answer three questions. What changed? What evidence supports the change? What should sales or marketing do next?
You can also use this sample to spot use-case expansion. If a competitor starts emphasising implementation simplicity or a new buyer persona, that can signal they're testing a different segment. The available evidence does not establish the full strategy, but it does support a review of your own campaign sequencing, especially if the rival's messaging is beginning to mirror your strongest value proposition.
5. Talent and Organisational Signals Report
Hiring is one of the cleanest public indicators of where a competitor is placing bets, but only if you separate replacement hiring from expansion hiring. A company replacing a departed head of product is not the same as a company building a new team around a specific capability. Your template should reflect that difference.
An analytics vendor might see three engineers and one manager hired for an embedded analytics team within a short span. That pattern suggests investment before a formal launch statement appears. It does not prove the feature is imminent, but it does justify continued monitoring and a roadmap check.
Reading the signal without overcalling it
Track job boards, LinkedIn role changes, executive announcements, and press releases. Then classify the pattern.
- Function hiring: Engineering, sales, success, marketing, or international expansion.
- Growth direction: Expansion, replacement, or reorganisation.
- Timing context: Funding, launch activity, or leadership change.
- Decision implication: Monitor, brief, or escalate.
A CRM platform where the Head of Product departs and no replacement appears quickly deserves attention, but the evidence still doesn't establish the cause. It may be normal turnover. It may be a strategy shift. The point of the report is to record the pattern cleanly so leaders can judge whether to act.
A hiring spike becomes meaningful when it matches a public product or GTM theme. Without that context, it's just a list of names.
The best samples use this section to brief leadership on resource allocation. If the rival is hiring into a region, function, or product line that overlaps with your priorities, the report should make that visible fast. As noted earlier, the UK competition environment values durable patterns over one-off noise, and talent signals are useful only when they're treated the same way.
6. Messaging and Narrative Evolution Timeline
Messaging timelines are where the story becomes visible. A homepage that once led with reduce manual work later shifts to automate workflows, then eventually to AI-powered autonomous operations. The public sequence matters because it shows how a rival wants the market to think about its product.
An enterprise software team can use this sample to distinguish tactical copy tests from strategic repositioning. If the same story appears across the homepage, landing pages, and campaign assets over time, that is more than a headline refresh. It may signal a deeper change in category framing.
Build the timeline around public snapshots
The timeline should include the date, the headline or hero message, the supporting proof point, and the external context if it is public. That context could be funding, a launch, or a market event. The timeline becomes more useful when the team can see what changed and what likely triggered it.
You don't need to over-explain every shift. A mid-market security platform moving from CISO-first language to business team-friendly language tells you enough to review targeting assumptions. The available evidence doesn't prove a downmarket move, but it does suggest a broader audience strategy worth checking.
Include only the evidence you can stand behind. If a message appears briefly and then disappears, label it as a test. If it persists across channels, treat it as a more durable narrative shift. That distinction helps marketing and product leaders avoid overreacting to temporary homepage experiments.
For teams that need a structured way to capture and reuse this kind of change, Metrivant's evidence chain is built around the sequence from source capture to movement synthesis, not around raw content collection alone.
7. Partnership, Integration, and Ecosystem Activity Report
Partnerships tell you where a competitor wants to gain influence. They can point to channel expansion, deeper platform strategy, or a push into a new buyer stack. A solid sample records the partner type, the integration depth, and the timing so the team can judge whether the move is tactical or structural.
A CRM vendor adding integrations with multiple HR platforms in a short period is a good example. The obvious interpretation is ecosystem growth. The more careful interpretation is that the company is trying to make itself relevant in adjacent workflows. The report should keep both visible.
Separate connectors from platform plays
Not every integration means the same thing. A lightweight connector that syncs data is not the same as a deep platform integration that changes how the product is used. That's why the sample should label each partner move clearly.
- Partner type: Technology, reseller, marketplace, or channel.
- Integration depth: Connector or platform-level.
- Public visibility: Announcement, marketplace listing, or product documentation.
- Competitive implication: Horizontal reach, vertical focus, or distribution expansion.
An analytics platform that announces partnerships with major cloud providers on the same day may be signalling a platform milestone, but the evidence still needs confirmation from product depth and market response. The report's job is not to declare victory or threat. It's to show which ecosystem moves deserve a closer look.
Metrivant's operating model fits this well because it preserves the supporting evidence alongside the signal. That matters when a partnership announcement looks big on the surface but proves to be narrow in scope once you inspect the source pages and supporting materials.
8. Investor Materials and Strategic Disclosure Analysis
Investor materials are useful because they reveal what leadership wants investors to believe about the next phase of growth. That makes them one of the better sources for strategic direction, especially when the language is specific and repeated. A solid sample extracts the stated priorities, not just the headline metrics.
A competitor's S-1 may state an international growth target, or an earnings call may emphasise vertical-specific product variants as a core initiative. Those disclosures matter because they often appear before the corresponding hiring or product signals are obvious in the market.
Keep the disclosure and the market signal separate
Use filings, earnings decks, investor letters, and funding materials as the source layer. Then compare them against product and GTM behaviour. If the public strategy says one thing and the operating signals say something else, that gap is worth reviewing.
Decision rule: treat investor language as intent, not proof. The evidence suggests priorities, but execution still has to show up in product, marketing, hiring, or channel movement.
This sample is especially useful for leadership reviews because it gives context to the public story. If the company is talking about customer concentration risk, the team can watch for retention pressure, product focus, or account expansion moves. If the company is talking about regional expansion, the team can look for hiring and localisation signals.
Metrivant's find SEC filings resource is relevant here because strategic disclosure only becomes useful when it is tied back to an inspectable evidence chain and compared against other public movement. That combination helps teams avoid overreading one investor slide and underreading the broader pattern.
8-Point Competitive Analysis Matrix
| Deliverable | Implementation complexity 🔄 | Resource requirements ⚡ | Expected outcomes 📊⭐ | Ideal use cases 💡 | Key advantages ⭐ |
|---|---|---|---|---|---|
| Competitive Positioning Matrix | 🔄🔄 | ⚡⚡ | 📊 Reveals competitor clustering and positioning gaps; ⭐⭐⭐ | Positioning reviews, GTM alignment, sales enablement | Evidence-based view of where rivals sit; quick detection of narrative shifts |
| Pricing and Packaging Audit | 🔄🔄 | ⚡⚡⚡ | 📊 Quantified pricing/packaging comparisons and change alerts; ⭐⭐⭐ | Pricing reviews, finance inputs, sales objection handling | Objective price data and change detection; supports pricing decisions |
| Product Feature and Roadmap Comparison | 🔄🔄🔄 | ⚡⚡⚡ | 📊 Feature parity, capability gaps, and roadmap signals; ⭐⭐⭐ | Roadmap prioritization, product marketing, competitive parity checks | Identifies table-stakes vs differentiators; detects innovation velocity |
| Go-to-Market and Campaign Activity Tracker | 🔄🔄 | ⚡⚡ | 📊 Near-real-time campaign and messaging signals; ⭐⭐ | Campaign planning, demand-gen timing, sales briefs | Early detection of messaging shifts and campaign timing; informs tactical responses |
| Talent and Organizational Signals Report | 🔄🔄 | ⚡⚡ | 📊 Hiring/org signals indicating priorities or instability; ⭐⭐ | Strategic planning, product resourcing insight, sales/BD forecasting | Reveals hiring focus and geographic expansion; early signal of strategic moves |
| Messaging and Narrative Evolution Timeline | 🔄🔄 | ⚡⚡ | 📊 Chronological view of messaging shifts and themes; ⭐⭐⭐ | Positioning strategy, brand leadership, competitive narrative analysis | Tracks narrative shifts before product/pricing changes; clarifies market signals |
| Partnership, Integration, and Ecosystem Activity Report | 🔄🔄 | ⚡⚡ | 📊 Visibility into partner/integration strategy and ecosystem growth; ⭐⭐⭐ | Platform strategy, BD opportunity assessment, GTM bundling analysis | Early signal of ecosystem moves and bundling threats; maps integration priorities |
| Investor Materials & Strategic Disclosure Analysis | 🔄🔄🔄 | ⚡⚡ | 📊 Long-term strategic priorities and financial targets; ⭐⭐⭐ | Executive strategy, M&A/finance analysis, competitive trajectory assessment | Quantified strategic claims and growth targets; reveals investor-facing positioning |
Next Steps for CI Excellence
Choose the template that matches the decision you need to support, then define the evidence chain before you collect the first source. If you are reviewing pricing, the workflow should start with public price capture and end with sales guidance. If you are reviewing product or GTM, the path should move from source capture to baseline comparison, then to confidence gating and operator review.
The strongest competitive analysis sample is the one your team can reuse without reinterpreting from scratch every time. That means clear source URLs, timestamps, changed excerpts, confidence notes, and a consistent refresh cadence. It also means knowing what the evidence does not prove. A pricing change doesn't prove a margin strategy. A hiring spike doesn't prove a launch. A messaging shift doesn't prove a segment pivot unless the broader pattern supports it.
Use the samples as decision tools, not archives. Product marketing can use them to sharpen positioning and enablement. CI teams can use them to reduce noise and improve coverage discipline. GTM leaders can use them to decide whether a rival move warrants a campaign response, a roadmap review, or continued monitoring.
If you want the workflow to stay defensible as the market changes, make the sample itself part of the operating cadence. Refresh it monthly for fast-moving rivals, review it after confirmed announcements, and keep the evidence visible so the team can trust the signal. That's how a template becomes an operating asset instead of a static document.
If you want a proof-first way to turn public competitor changes into decision-ready intelligence, visit Metrivant. It monitors a defined rival set, preserves inspectable evidence, and helps teams route verified signals into pricing, positioning, launch, and GTM workflows.